
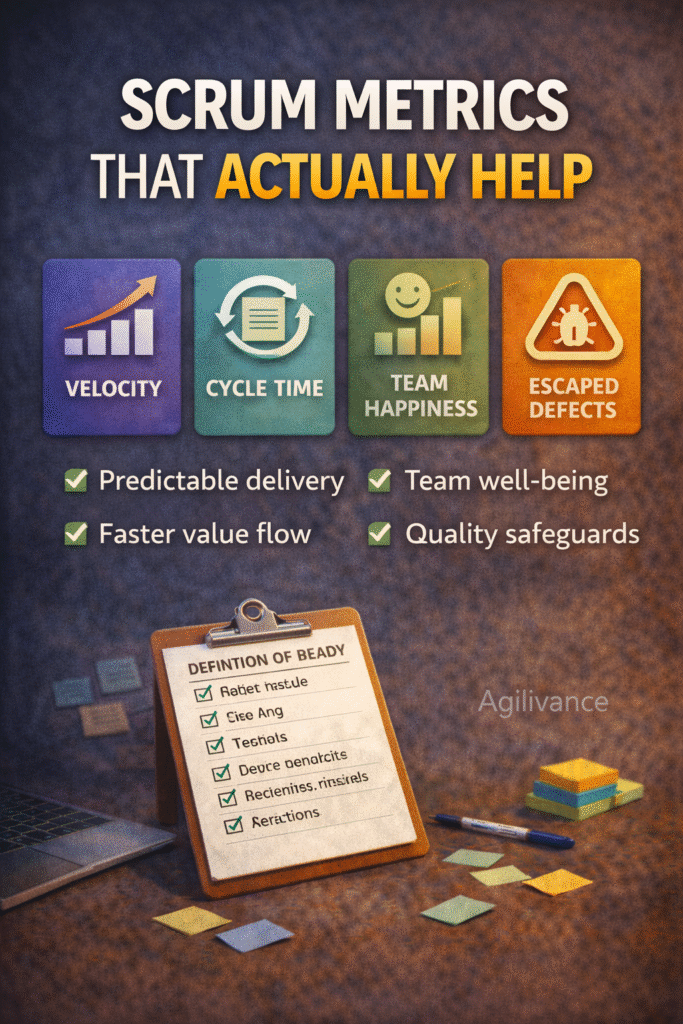
Velocity, Burndown, Cycle Time (and What to Avoid)
Metrics should reduce uncertainty and improve decisions. When used poorly, metrics create fear, gaming, and fake predictability.
This guide explains the most useful Scrum/Agile delivery metrics in a practical, vendor-neutral way-what they tell you, how to use them, and the common traps to avoid.
Who this is for: Scrum Masters, Product Owners, Delivery Leads, Engineering Leaders
Use this when: stakeholders ask for “progress,” teams argue about velocity, or predictability is weak
Examples are illustrative and do not represent complete project solutions.
The one rule that makes metrics safe
Measure the system, not the person.
If metrics are used to rank individuals, people will game them and the metrics will stop reflecting reality.
Metric #1: Velocity (what it is and how to use it)
What velocity tells you?
Velocity is a trend showing how much work a team typically finishes per sprint (in story points or completed items).
What velocity is good for?
- Sprint forecasting (roughly how much work the team can take)
- Detecting change over time (stability, disruption, team change)
What velocity is not for?
- Comparing teams
- Setting targets like “increase velocity by 20%”
- Measuring productivity
Practical use (safe)
- Use a 3–5 sprint rolling average as a reference range
- Adjust down if support load/incidents are high
- Keep buffer (10–20%)
Metric #2: Sprint Burndown (use it correctly)
What burndown tells you?
Burndown shows whether remaining work is decreasing through the sprint.
What burndown is good for?
- Daily visibility: “Are we trending toward finishing?”
- Revealing scope creep (work added mid-sprint)
Common burndown traps
- Updating late (burndown becomes meaningless)
- Using it to pressure the team daily
- Treating it as a precise predictor
Practical use
Use burndown as a conversation tool:
- “Are we finishing work?”
- “Is too much work in progress?”
- “Did scope increase?”
Metric #3: Cycle Time (one of the most useful)
What cycle time tells you ?
Cycle time is how long work takes from start to done (based on your workflow states).
What cycle time is good for?
- Predictability (how long items typically take)
- Identifying bottlenecks (work stuck in review/testing)
- Improving flow (reducing waiting)
Practical use
- Track cycle time for similar work types (avoid mixing huge and tiny items)
- Reduce WIP and improve DoD adherence to lower cycle time
Metric #4: Throughput (simple and powerful)
Throughput is the number of items finished per time period (per sprint/week).
Good for:
- Trend of delivery volume
- Forecasting when work items are similar size
Not good for:
- Comparing teams with different work types
- Mixing bugs/features/spikes without classification
Metric #5: Work in Progress (WIP) (the hidden lever)
High WIP is a common root cause of slow delivery and spillover.
What to do:
- Limit WIP intentionally
- Swarm to finish items
- Avoid starting new work while work is stuck near done
Metric #6: Spillover / Carryover (your simplest improvement metric)
Track:
- number of carried items per sprint
- % of planned work finished to DoD
Use it to find root causes (DoR, DoD, slicing, dependencies), not to blame.
Internal link: Why Sprints Spill Over (Post #8)
What to avoid (metrics that cause damage)
Avoid #1: Measuring individuals
It creates fear and gaming. Metrics become unreliable.
Avoid #2: “Utilization” as a delivery target
Utilization targets push teams to 100% loading, which increases queue time and delays.
Avoid #3: Single-number management
One metric cannot represent delivery health. Use a small set.
A practical metrics set (To begin with)
If you want a safe starter dashboard, use:
- Velocity (trend only)
- Cycle time (trend)
- WIP (current)
- Spillover/carryover (trend)
This set helps decisions without turning into bureaucracy.
FAQs
Should we use velocity if we estimate poorly?
Yes, as a trend. But improve slicing and estimation consistency.
Should we show burndown to stakeholders?
You can, but provide context. Burndown is a team tool, not a performance scorecard.
What is the best metric for predictability?
Often cycle time is the strongest, because it reflects flow and bottlenecks.
Next steps (internal links)
Recommended reading: